
CPU or GPU? A Practical Testing Framework for Routing SLM and LLM Workloads at Scale

How to choose model-and-compute routes empirically—not by model size, benchmark hype, or GPU-first assumptions.
Executive Summary
The infrastructure question behind enterprise AI is often framed too narrowly: CPU or GPU? SLM or LLM? Local or cloud?
Those are important choices, but they are not the real decision.
The real decision is:
For this workload class, what is the lowest-cost model-and-compute route that meets the required quality, latency, throughput, reliability, scale, security, and governance thresholds?
That answer should be measured, not guessed.
A small language model running on CPUs may be the best route for high-volume classification. A GPU-backed model may be better when batching and utilization are high. A larger LLM may be required for complex reasoning, high-risk drafting, or final review. A hybrid path may be best: smallest viable model first, escalation to a larger model only when confidence, risk, or task complexity requires it.
The point is not to declare a permanent winner between CPUs and GPUs, or between SLMs and LLMs. The point is to define a repeatable testing framework that identifies the most economical route per successful outcome.
That requires five shifts:
- From model-size assumptions to workload classes.
- From cost per token to cost per successful outcome.
- From synthetic benchmarks alone to task-specific evals and production-like load tests.
- From one-model-for-everything to hybrid routing and escalation.
- From one-time benchmarking to continuous validation, drift monitoring, and re-benchmarking.
The future AI control plane will not simply route prompts to models. It will route workloads to the right model, compute pool, policy boundary, and validation path.

1. The Problem With GPU-First and Model-Size-First Thinking
A lot of AI infrastructure strategy starts with a shortcut.
- “Serious AI workloads need GPUs.”
- “Small models should handle everything possible.”
- “Frontier models are safer because they are smarter.”
- “CPU inference is always cheaper.”
- “Cost per token tells us the economics.”
Each statement can be true in a specific situation. None is true as a universal operating principle.
A batch extraction workload behaves differently from a real-time assistant. A low-risk summarization task behaves differently from a regulated recommendation workflow. A GPU route may look expensive at low utilization and efficient at high utilization. A CPU route may look cheap until concurrency pushes P95 latency beyond the service-level objective. A small model may pass routine cases and fail edge cases. A large model may overperform the task and overconsume the budget.
That is why model and infrastructure routing should be empirical.
The practical answer is not “CPU” or “GPU.” It is not “SLM” or “LLM.”
The practical answer is:
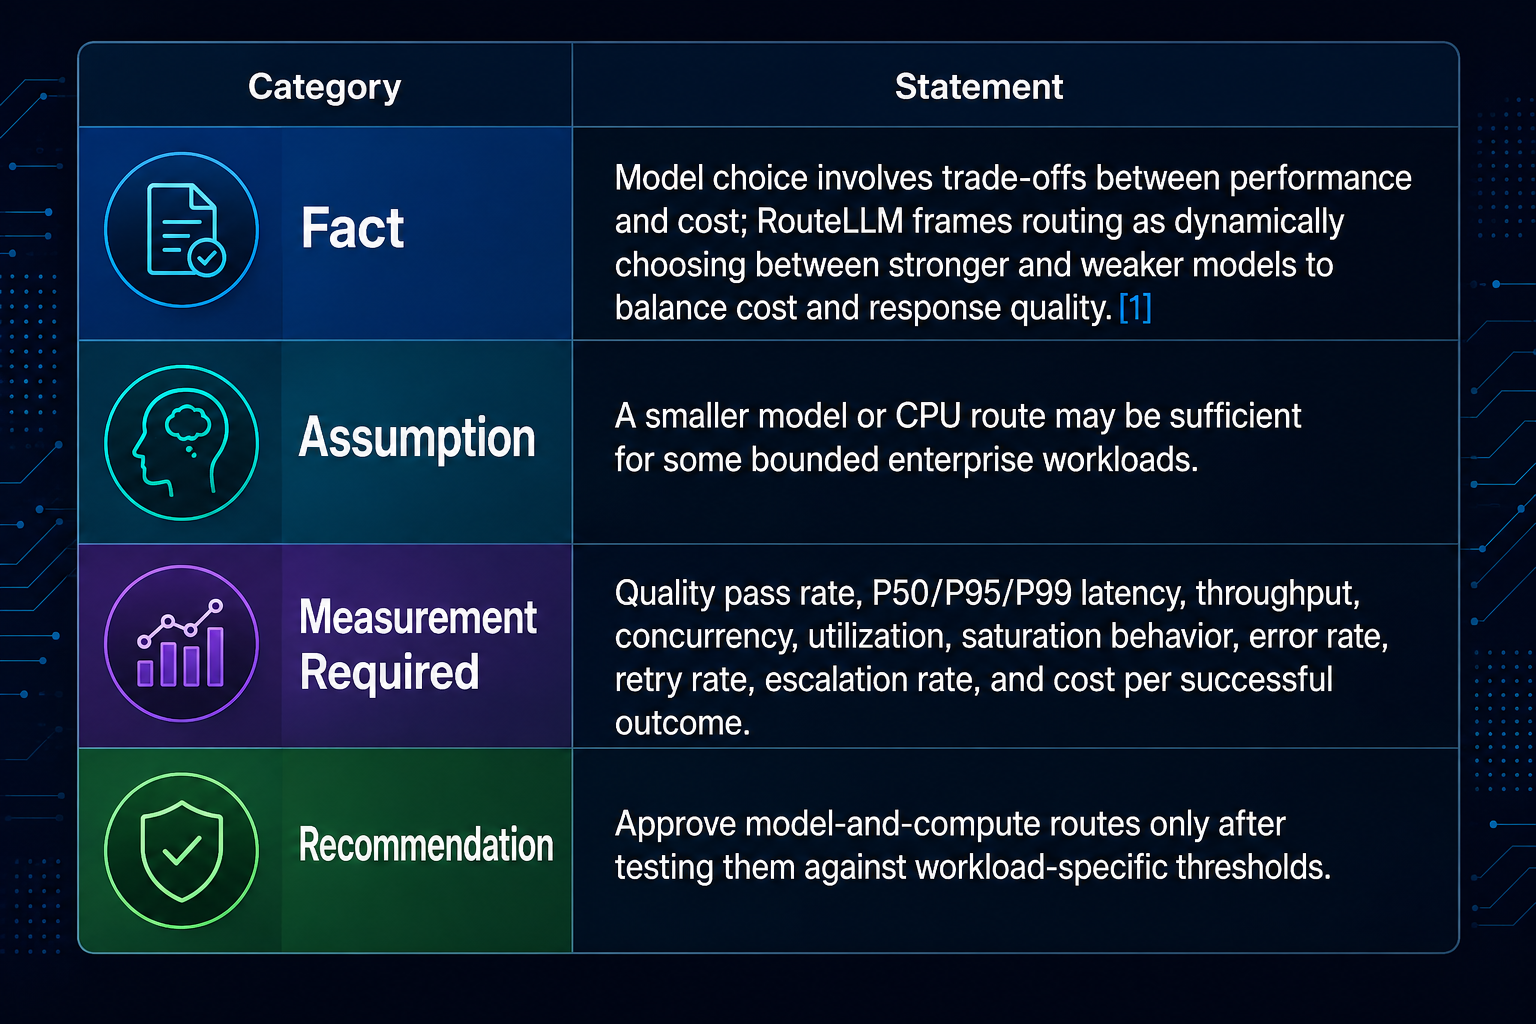
Test the workload, then route based on measured outcomes.
2. The Right Economic Unit: Cost per Successful Outcome
The wrong question is:
Which model is cheapest per token?
The better question is:
Which route produces the required outcome at the lowest total cost?

A route is more than a model. It is the combination of:
- Model
- Compute pool
- Runtime and serving stack
- Prompt and context strategy
- Retrieval path
- Tool access
- Batch or real-time execution mode
- Retry policy
- Escalation policy
- Human review requirement
- Observability and logging requirement
- Governance and data-boundary requirement
Token cost is only one input. A route with cheap tokens can be expensive if it fails often, requires retries, creates human review burden, violates latency targets, or produces outputs that cannot be trusted. A route with higher inference cost can be cheaper overall if it succeeds more often, reduces manual correction, or improves throughput at scale.
Use this as the core economic metric:
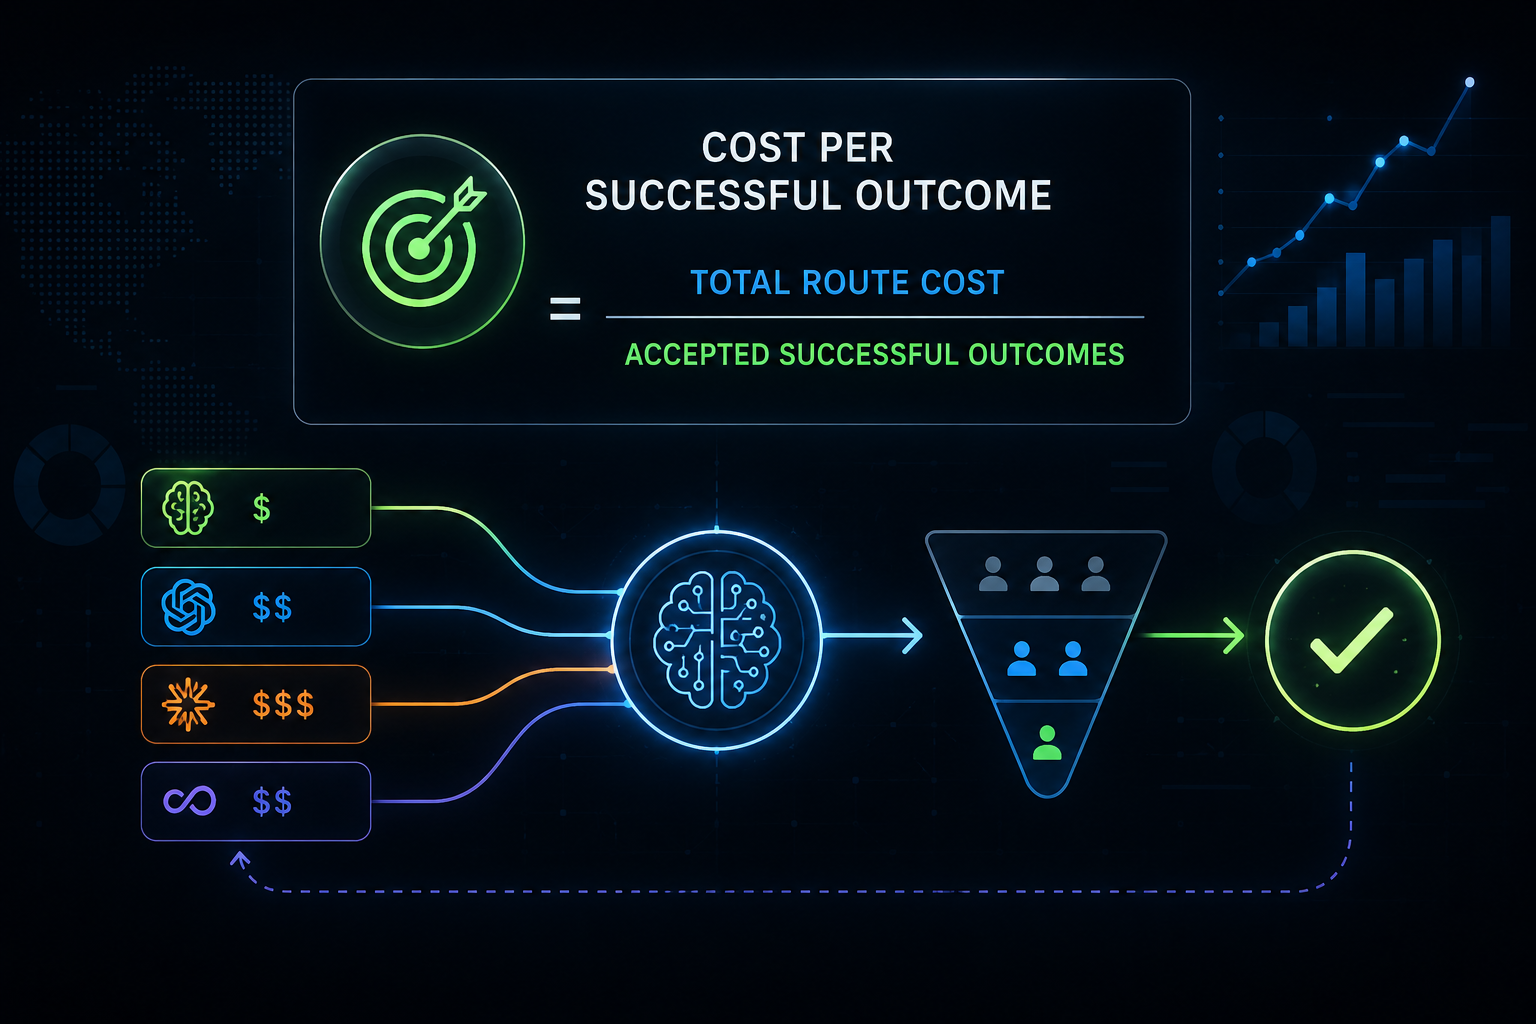
Where total route cost may include:
- Compute cost
- Inference runtime cost
- Model-serving overhead
- Retrieval and storage cost
- Network cost
- Retry cost
- Fallback or escalation cost
- Human review cost
- Failure remediation cost
- Idle capacity cost
- Monitoring, tracing, and logging cost
This is the move from infrastructure accounting to workload economics.
3. Start With Workload Classes
Before testing models, define workload classes.

A workload class is a repeatable category of AI work with a common task pattern, input shape, risk profile, performance requirement, and success definition.
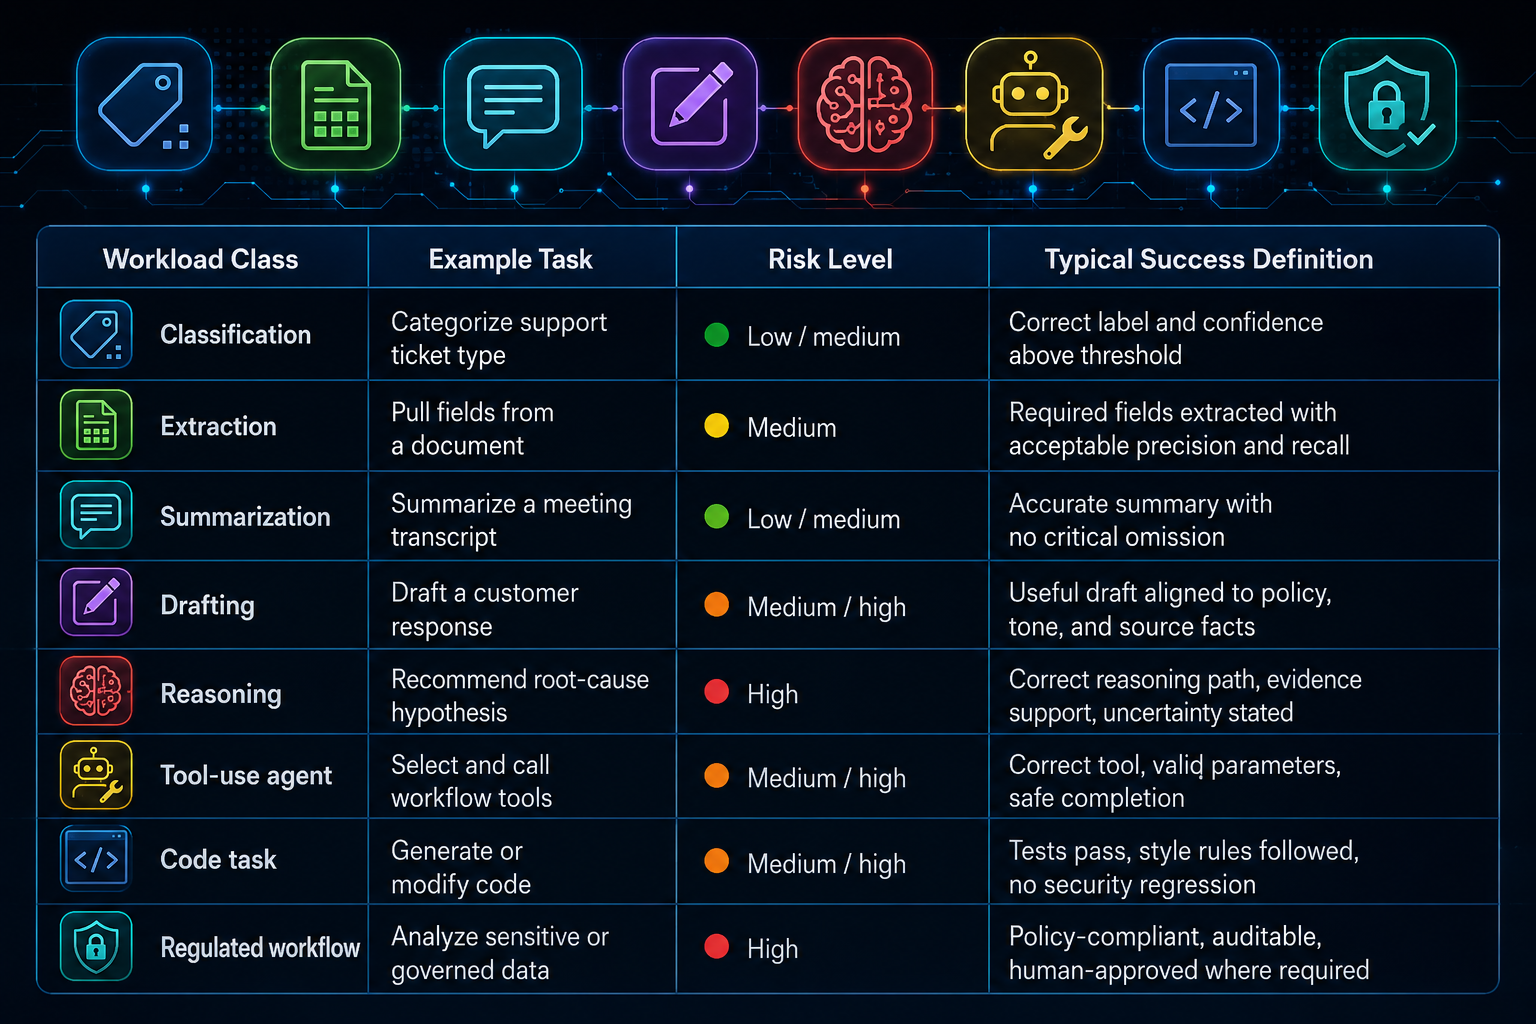
A route should be approved for a workload class, not vaguely approved for “AI.”
The more precise the workload class, the easier it is to select candidate models, define success thresholds, and compare CPU and GPU economics fairly.
4. Define Success Thresholds Before Benchmarking
Testing without thresholds turns benchmarking into opinion.
Before testing SLMs, LLMs, CPUs, GPUs, local routes, or hosted routes, define the minimum acceptable outcome.

Quality Thresholds
Examples:
- Minimum task-success rate
- Maximum hallucination or unsupported-claim rate
- Minimum extraction precision / recall
- Maximum critical-error rate
- Minimum policy-compliance score
- Minimum human acceptance rate
- Required citation or provenance quality
- Minimum tool-call correctness
OpenAI’s evaluation guidance emphasizes designing task-specific evals for real-world distributions, combining metrics with human judgment, and avoiding “vibe-based” evaluation.[2]
Latency Thresholds
Examples:
- P50 latency target
- P95 latency target
- P99 latency target
- Maximum time to first token
- Maximum inter-token latency
- Maximum end-to-end workflow completion time
NVIDIA’s GenAI-Perf documentation lists LLM performance metrics such as output token throughput, time to first token, inter-token latency, and request throughput.[3] vLLM’s benchmarking documentation similarly supports latency and throughput testing with realistic datasets and workload patterns.[4]
Throughput and Concurrency Thresholds
Examples:
- Requests per second
- Jobs per hour
- Concurrent users or sessions
- Tokens per second per node
- Batch completion window
- Maximum queue depth
Reliability Thresholds
Examples:
- Error rate
- Timeout rate
- Retry rate
- Tool-call failure rate
- Recovery behavior after saturation
- Availability under expected load
Cost Thresholds
Examples:
- Maximum cost per successful classification
- Maximum cost per accepted draft
- Maximum cost per resolved workflow
- Maximum cost per 1,000 successful batch jobs
- Monthly cost ceiling by traffic scenario
Recommendation
Set thresholds before running benchmarks. Otherwise, teams tend to rationalize the route they already wanted.
5. Shortlist Models Without Over-Testing
The model universe is too large to test exhaustively.

A practical shortlist should include a small number of candidates across capability tiers:
- Small efficient model — candidate for simple or high-volume tasks.
- Specialized or domain-tuned model — candidate for narrow enterprise workflows.
- Mid-sized general model — candidate for synthesis, drafting, and moderate reasoning.
- Large / frontier model — candidate for complex reasoning, high-risk decisions, or final review.
- Current production baseline — required for comparison.
The goal is not to benchmark every model. The goal is to determine whether a lower-cost route can meet the threshold and where escalation becomes necessary.
Shortlisting Filters
Use filters before testing:
- License and deployment eligibility
- Data sensitivity and locality requirements
- Context-window requirement
- Tool-use support
- Structured-output reliability
- Known strengths by task type
- Operational maturity
- Runtime compatibility
- Quantization support
- Hardware compatibility
- Security and compliance constraints
Recommendation
Start with five to seven candidates per workload class. Eliminate quickly based on threshold failures. Deep-test only routes that survive early screening.
6. Benchmark CPU and GPU Pools Fairly
CPU versus GPU comparisons often fail because the test is unfair.
A GPU route may be tested with optimized batching, a tuned runtime, and high concurrency, while the CPU route is tested naively. Or a CPU route may be tested at low steady volume while the GPU route is penalized for idle capacity. Neither comparison is useful.

A fair benchmark should hold these variables explicit:
- Hardware configuration
- Runtime stack
- Model format and quantization
- Batch size
- Context length
- Input and output token distributions
- Concurrency level
- Warm versus cold start
- Cache behavior
- Memory limits
- Autoscaling behavior
- Queueing behavior
- Observability method
CPU Pool Testing
CPU testing should evaluate:
- Single-request latency
- Concurrency behavior
- Throughput per node
- Memory pressure
- Quantized-model performance
- Batch efficiency
- Saturation point
- Cost under low, medium, and high utilization
CPU routes deserve serious testing because modern inference stacks can optimize models for CPU execution. ONNX Runtime supports 8-bit quantization and includes pre-processing steps intended to improve quantization quality, with transformer-specific shape inference called out as useful for transformer models.[5] Hugging Face Optimum Intel provides an interface between Transformers and OpenVINO, which supports inference across Intel CPUs, GPUs, and other accelerators and includes model optimization techniques such as quantization, pruning, and distillation.[6]
GPU Pool Testing
GPU testing should evaluate:
- Tokens per second
- Batch efficiency
- GPU utilization
- Memory utilization
- Concurrency handling
- Queue depth
- Saturation point
- Idle-capacity cost
- Multi-model serving behavior
- Cost under low, medium, and high utilization
Recommendation
Do not compare CPU and GPU routes at one traffic level. Compare them across traffic bands: low volume, expected volume, peak volume, burst volume, and batch volume.
7. Evaluate Quality and Task Success
Infrastructure metrics are not enough.
A fast, cheap route that fails the task is not economical. A slow, expensive route that overperforms the quality requirement may also be inefficient.

Quality testing should be designed around task success.
Build a Representative Test Set
Each workload class needs a test set that includes:
- Typical cases
- Edge cases
- Adversarial or confusing cases
- Long-context cases
- Short-context cases
- High-risk cases
- Known historical failures
- Policy-sensitive cases
- Multilingual or format-specific cases where relevant
Use Multiple Evaluation Methods
A robust evaluation may include:
- Deterministic checks
- Schema validation
- Unit or integration tests
- Reference-answer comparison
- Human review
- LLM-as-judge evaluation
- Pairwise comparison
- Policy compliance review
- Post-hoc error analysis
AWS Bedrock model evaluation documentation supports the same general pattern: automatic evaluation with curated or custom datasets, human evaluation for subjective metrics, and LLM-as-judge evaluation for dimensions such as correctness, completeness, faithfulness, refusal, and harmfulness.[7]
Judge Design Matters
If using a model judge, define the judge prompt carefully. The judge should evaluate specific criteria, not provide a vague preference.
Example judge dimensions:
- Correctness
- Completeness
- Evidence support
- Policy compliance
- Formatting compliance
- Tool-use correctness
- Safety behavior
- Actionability
- Critical-error presence
OpenAI’s guidance notes that LLM-as-judge evaluation can be more scalable than human evaluation, but recommends validating agreement against human labels and controlling for biases such as response length.[8]
Human Validation
Human validation is still necessary for high-risk or ambiguous tasks. Humans should review:
- A sample of accepted outputs
- A sample of rejected outputs
- Disagreements between judges
- High-severity cases
- Borderline cases near the routing threshold
Recommendation
Use model judges to scale evaluation, but use humans to calibrate and audit the judge. Do not allow the judge to become an unvalidated source of truth.
8. Test Latency, Throughput, Concurrency, Utilization, and Saturation
A route that looks good in single-request testing may fail under load.
Production routing requires load testing across realistic traffic scenarios.

Metrics to Capture
- P50, P95, and P99 latency
- Time to first token
- Inter-token latency
- End-to-end workflow duration
- Requests per second
- Tokens per second
- Concurrent sessions
- Queue depth
- Timeout rate
- Retry rate
- Error rate
- CPU utilization
- GPU utilization
- Memory utilization
- Network throughput
- Cost at utilization bands
- Saturation behavior
MLPerf Inference provides a useful benchmarking reference point: its datacenter benchmark measures how fast systems process inputs and produce results, and its scenarios use load generators to produce request patterns and measure scenario-specific metrics.[9]
Traffic Scenarios
Test at multiple levels:
- Low volume: Baseline steady-state traffic.
- Expected volume: Current production or near-term forecast.
- Peak volume: Busy-hour or campaign-driven load.
- Burst volume: Sudden spike or backlog drain.
- Failure mode: One pool degraded, fallback route active.
- Batch mode: Offline jobs or scheduled workloads.
Saturation Testing
At saturation, watch for:
- Latency cliffs
- Queue growth
- Error spikes
- Memory pressure
- GPU underutilization or overcommit
- CPU thread contention
- Batch inefficiency
- Retry storms
- Cascading fallback
Recommendation
A route is not production-ready until the team knows where it saturates and what happens when it does.
9. Calculate Total Cost per Successful Outcome
Cost should be calculated only after quality and performance thresholds are applied.
A route that fails the minimum success threshold should not win on cost.

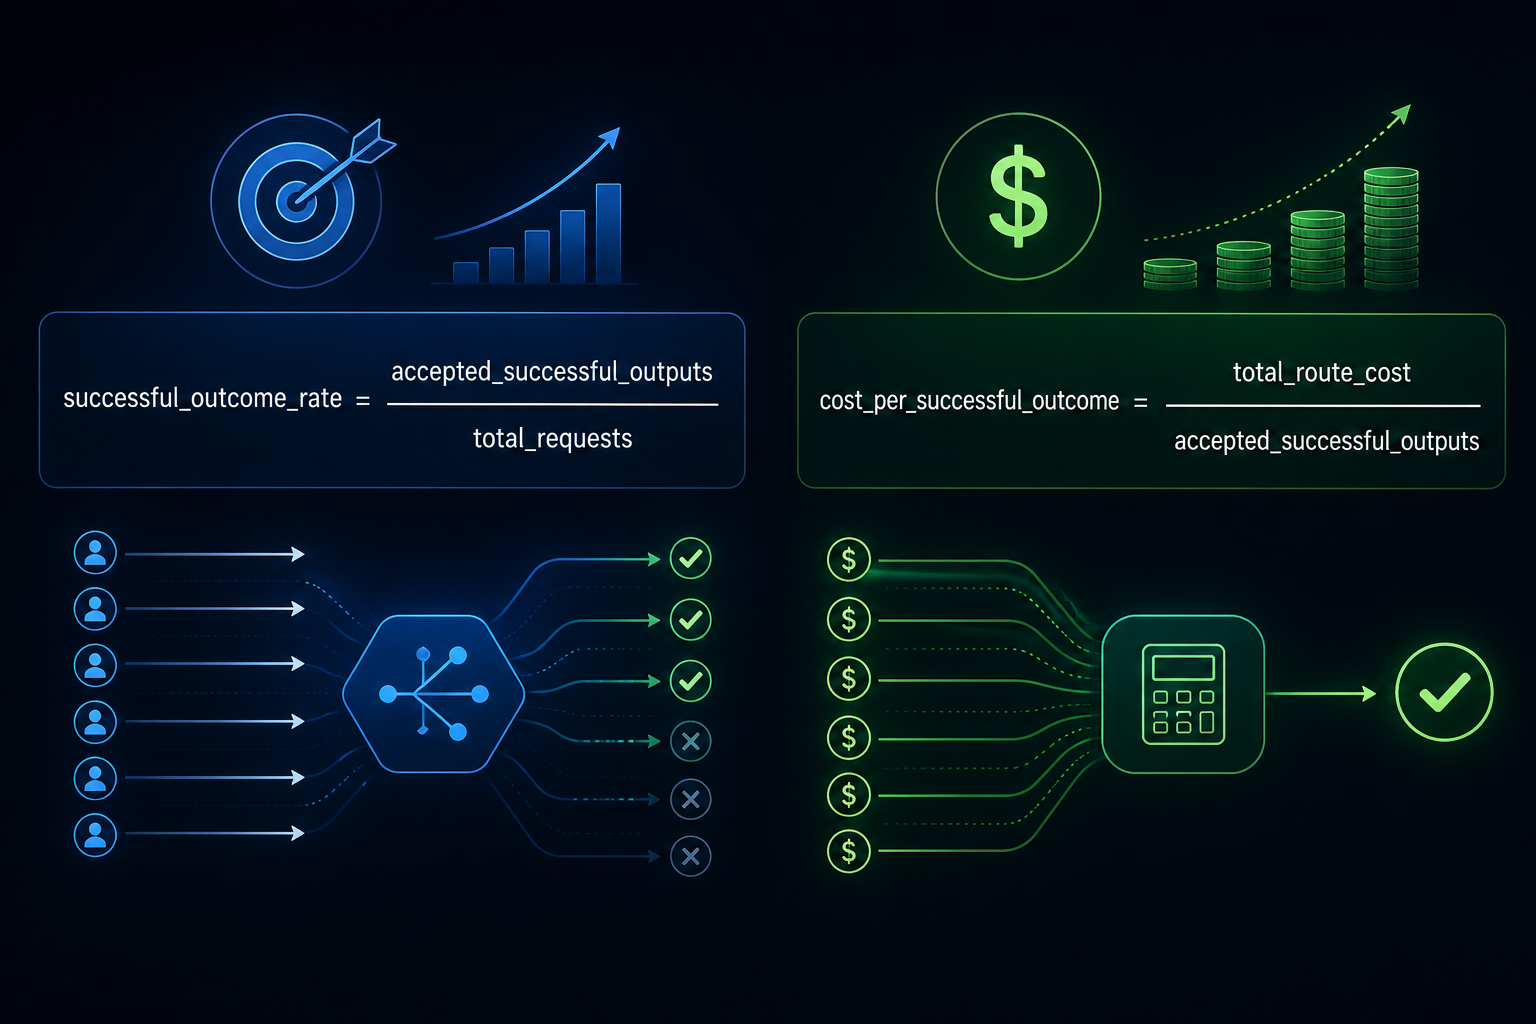
Base Formula
Hybrid Route Formula
For cascaded or hybrid routing:
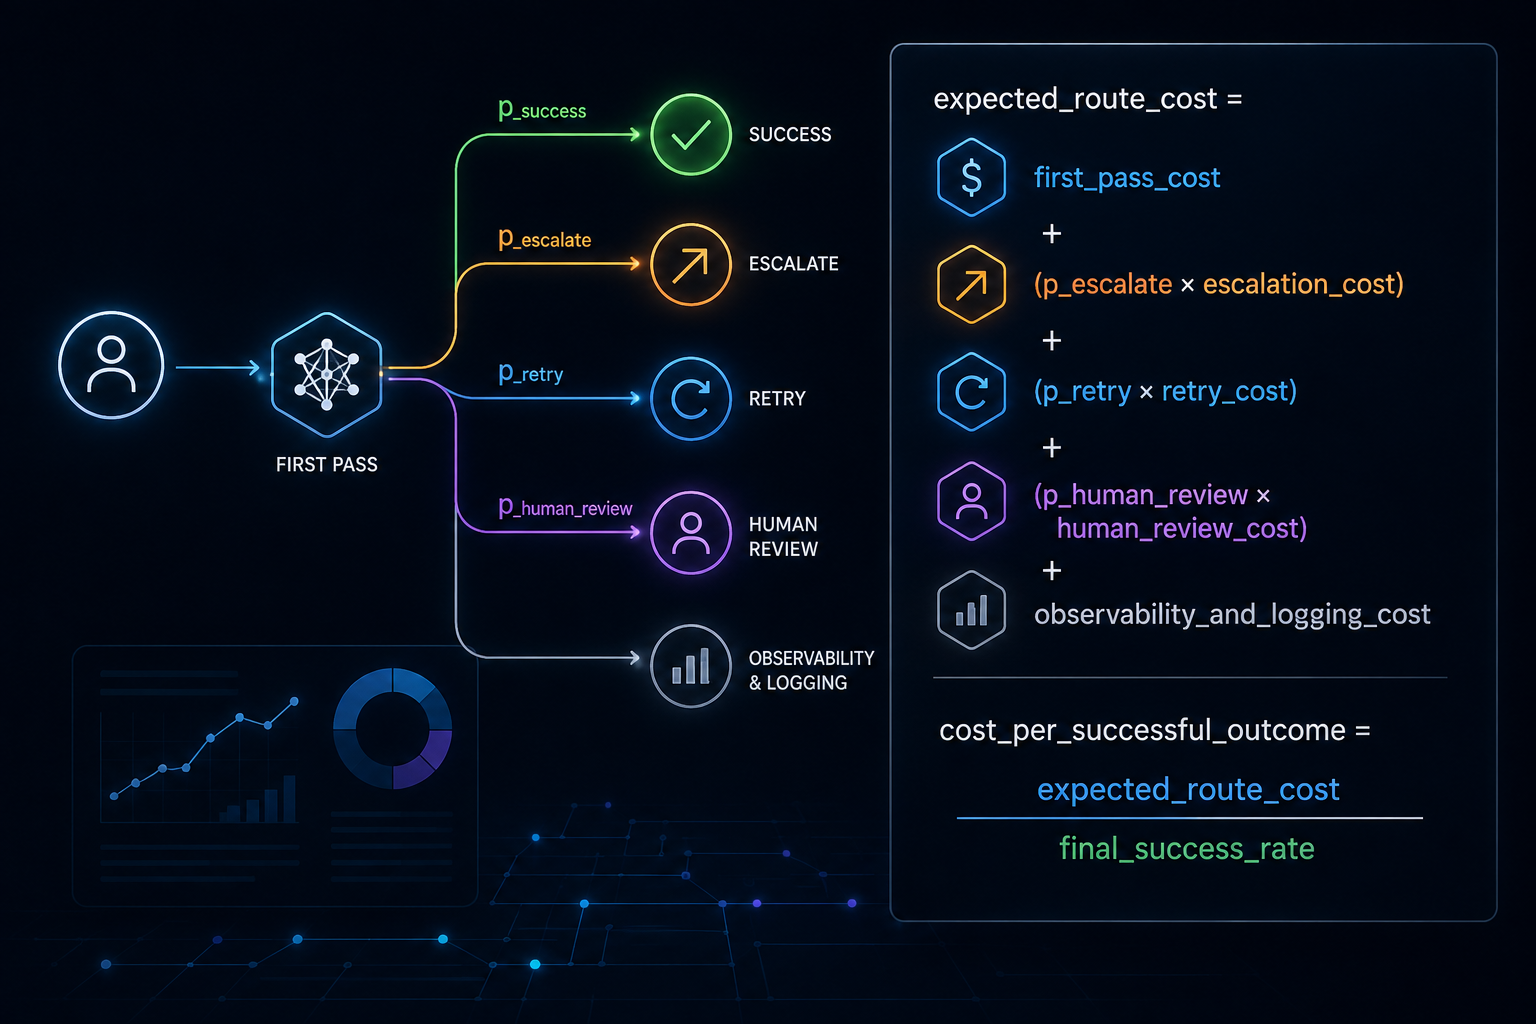
Include These Costs
- Compute
- Inference serving
- Model hosting
- Storage and retrieval
- Networking
- Retry and fallback
- Human review
- Monitoring and logging
- Idle capacity
- Operational overhead where material
Recommendation
Optimize for the cheapest eligible route that meets the success threshold, not the cheapest route that produces an answer.
10. Create a Routing Score or Decision Function
A routing score helps convert benchmark results into operational decisions.

One practical structure:
routing_score =
  (quality_weight × normalized_quality)
- (cost_weight × normalized_cost_per_success)
- (latency_weight × normalized_latency_penalty)
+ (capacity_weight × normalized_available_capacity)
- (risk_weight × normalized_policy_or_reliability_risk)
Weights should change by workload class.
- Customer-facing drafting may weight quality and policy compliance heavily.
- Batch extraction may weight cost and throughput heavily.
- Incident response may weight latency and reliability heavily.
- Regulated workflows may weight locality, auditability, and human approval heavily.
Eligibility Before Optimization
Apply eligibility rules before scoring.
Exclude a route if it fails:
- Data sensitivity requirements
- Locality requirements
- Security requirements
- Compliance requirements
- Minimum quality threshold
- Maximum latency threshold
- Required reliability threshold
- Deployment or licensing constraints
Then score only the remaining eligible routes.
Recommendation
Do not let a routing score override hard policy or quality gates. Scoring is for choosing among eligible routes, not rationalizing ineligible ones.
11. Run Break-Even Analysis by Traffic Volume
The right route may change as volume changes.
A CPU route may be more economical at low volume because it avoids GPU idle capacity. A GPU route may become more economical at high volume if batching and utilization improve. A larger model may be too expensive for every request but economical as an escalation path.

Break-Even Formula
For two eligible routes, A and B:
monthly_cost_A = fixed_cost_A + (variable_cost_per_success_A × monthly_successful_outcomes)
monthly_cost_B = fixed_cost_B + (variable_cost_per_success_B × monthly_successful_outcomes)
The break-even volume is where:
monthly_cost_A = monthly_cost_B
Or:
break_even_volume =
  (fixed_cost_B - fixed_cost_A)
/ (variable_cost_per_success_A - variable_cost_per_success_B)
This only applies if the denominator is positive and both routes meet the same required success threshold.
Test Traffic Bands
Evaluate at:
- 1,000 requests per day
- 10,000 requests per day
- 100,000 requests per day
- 1 million requests per day
- Peak-hour bursts
- Batch windows
For each traffic band, calculate:
- Required nodes or accelerators
- Expected utilization
- Cost per request
- Cost per successful outcome
- Latency distribution
- Saturation risk
- Operational complexity
- Fallback capacity
Recommendation
Create a route map by traffic volume. Do not assume the best route at 1,000 requests per day remains best at 1 million requests per day.
12. Use Hybrid Routing: Smallest Viable Model First
In many workloads, the optimal production pattern is hybrid.
Start with the smallest viable model for routine cases. Escalate only when needed.

A hybrid route might look like this:
- Small model handles first-pass classification or draft.
- Confidence or judge check evaluates output quality.
- Mid-sized model handles ambiguous cases.
- Large model handles high-risk or complex cases.
- Human reviewer handles regulated, irreversible, or low-confidence cases.
This pattern is supported by the broader routing literature. FrugalGPT proposes LLM cascades that learn which combinations of LLMs to use for different queries to reduce cost and improve performance.[10] RouteLLM similarly proposes router models that dynamically select between stronger and weaker LLMs to optimize cost and response quality.[1:1]
Escalation Triggers
Potential triggers:
- Low confidence score
- Judge failure
- Policy-sensitive content
- High customer impact
- Long or ambiguous context
- Tool-use uncertainty
- Missing citation or provenance
- High-severity workflow category
- Repeated failure or retry
- User override
Recommendation
Escalation should be part of the route design, not an afterthought. A small-model route is only safe if the system knows when not to trust it.
13. Validate in Production and Monitor Drift
Benchmarking is not a one-time event.
Production workloads drift. Inputs change. User behavior changes. Prompt templates change. Retrieval sources change. Model versions change. Traffic patterns change. Cost structures change. Hardware availability changes. Quality expectations change.
A route that was optimal last quarter may no longer be optimal today.

Production Signals to Monitor
- Acceptance rate
- Escalation rate
- Human correction rate
- Judge disagreement rate
- Latency distribution
- Cost per successful outcome
- Error and timeout rate
- Saturation events
- User feedback
- Policy violations
- Input-distribution drift
- Output-quality drift
NIST’s AI Risk Management Framework playbook recommends ongoing procedures for monitoring AI system performance, trustworthiness, drift, decontextualization, incidents, and other behavior factors.[11]
Re-Benchmarking Triggers
Re-benchmark when:
- A model version changes
- Hardware pool changes
- Prompt or context strategy changes
- Traffic volume changes materially
- Quality drops
- Cost increases
- Latency misses thresholds
- New models become available
- Compliance or locality requirements change
- A new workload class is introduced
Recommendation
Treat routing as an operational control loop: measure, route, observe, recalibrate, and re-benchmark.
14. Worked Example: Support-Ticket Triage and Response Drafting
The following example is illustrative. The numbers are hypothetical and should not be treated as benchmark claims.

Workload Class
Task: Classify incoming support tickets and draft first-response recommendations.
Risk level: Medium.
Success definition: Correct category, correct severity band, useful draft, no policy violation, response within latency target.
Traffic: Mix of real-time and batch.
Human review: Required for high-severity tickets.
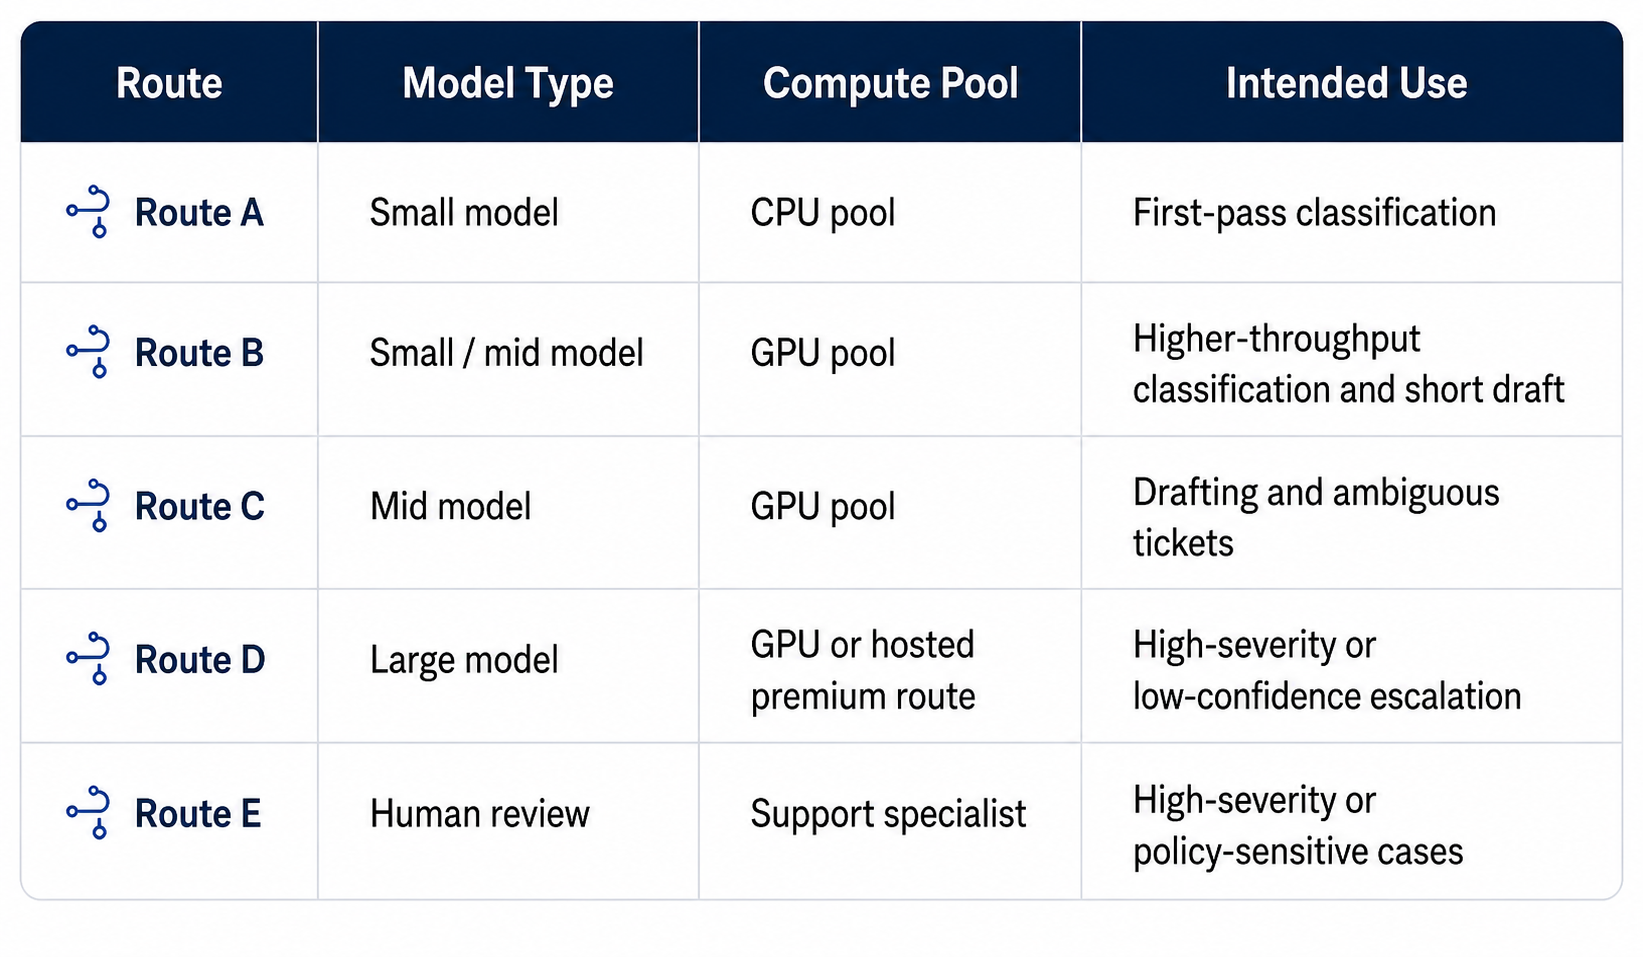
Candidate Routes
Hypothetical Benchmark Results
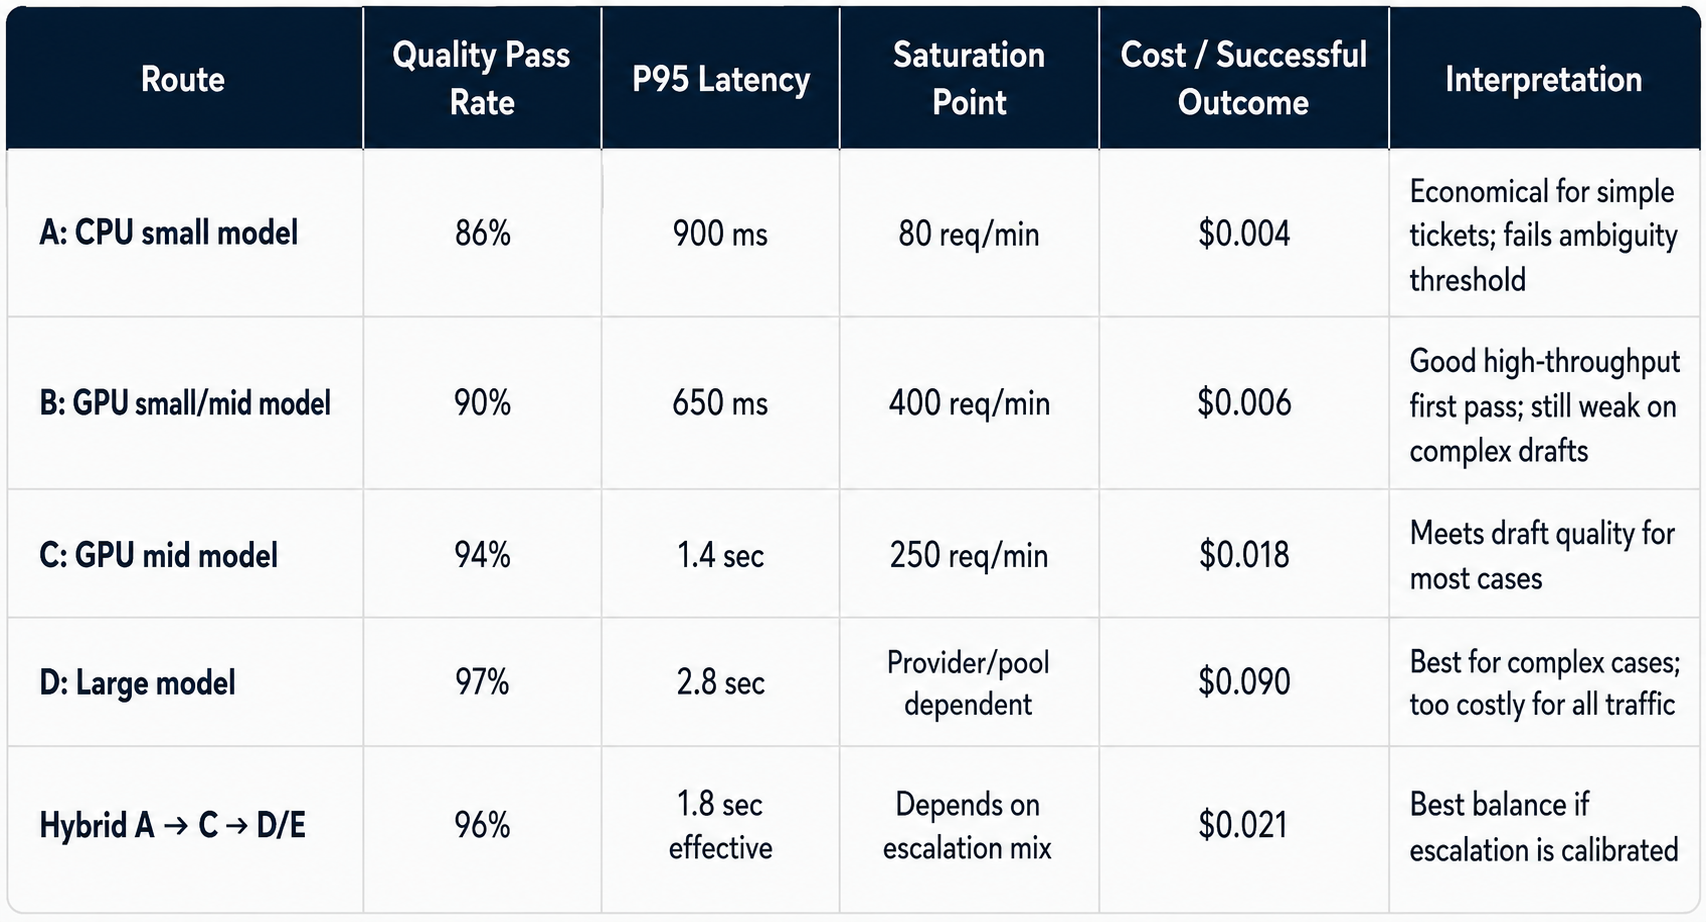
Assumptions in the Example
- 70% of tickets are routine.
- 20% require mid-model drafting.
- 8% require large-model escalation.
- 2% require human review.
- All routes meet security and data-handling eligibility requirements.
- Cost values include estimated retry and review overhead.
Recommended Route
- Route A handles simple classification.
- Confidence and severity checks decide whether to accept or escalate.
- Route C handles ambiguous tickets and drafts.
- Route D handles high-complexity or high-impact cases.
- Route E handles high-severity, regulated, or policy-sensitive tickets.
Why This Works
The team does not choose one model for everything. It creates a workload-specific policy:
Use the cheapest eligible route that meets quality and latency thresholds; escalate when confidence, risk, or complexity requires it.
15. Reusable Decision Matrix

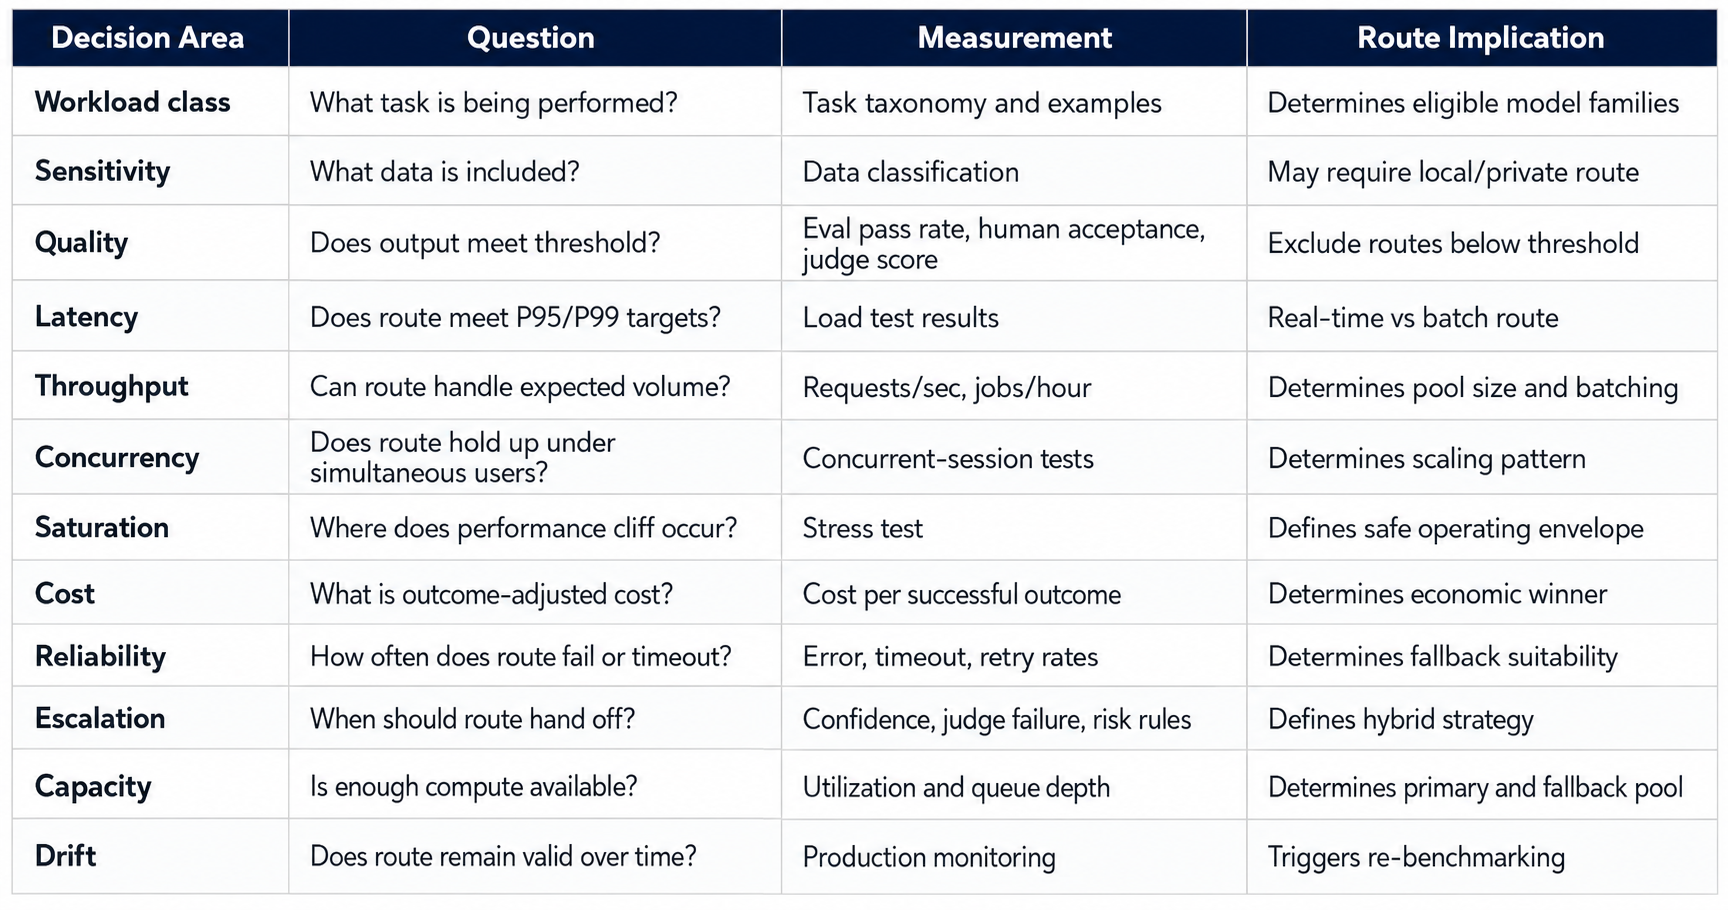
16. Conclusion: Route Empirically, Not Ideologically
The CPU versus GPU debate is often framed as a hardware argument.
It should be framed as a workload-routing argument.
The real question is not which infrastructure is better in the abstract. The real question is which model-and-compute route produces the required business outcome for a specific workload at the lowest sustainable cost.
Sometimes that route will be a small model on CPUs. Sometimes it will be a GPU-accelerated model. Sometimes it will be a frontier LLM. Sometimes it will be a hybrid path where simple requests are handled cheaply and complex requests escalate.
The only durable answer is measurement.
Define workload classes. Set success thresholds. Shortlist models carefully. Benchmark CPU and GPU pools fairly. Evaluate quality and task success. Test latency, throughput, concurrency, utilization, and saturation. Calculate cost per successful outcome. Run break-even analysis. Deploy hybrid routing. Monitor drift. Re-benchmark periodically.
That is how teams move from model enthusiasm to production economics.
And it is how model routing becomes a control-plane discipline: not a guess, not a preference, but a repeatable decision system for matching AI workloads to the right intelligence and infrastructure path.
Source List
- Isaac Ong et al., “RouteLLM: Learning to Route LLMs with Preference Data,” arXiv, v4 revised 2025. https://arxiv.org/abs/2406.18665 ↩︎ ↩︎ ↩︎ ↩︎ ↩︎ ↩︎
- OpenAI API documentation, “Evaluation best practices.” https://developers.openai.com/api/docs/guides/evaluation-best-practices ↩︎ ↩︎ ↩︎
- NVIDIA Triton Inference Server documentation, “GenAI-Perf.” https://docs.nvidia.com/deeplearning/triton-inference-server/user-guide/docs/perf_analyzer/genai-perf/README.html ↩︎ ↩︎ ↩︎ ↩︎
- vLLM documentation, “Benchmark CLI.” https://docs.vllm.ai/en/latest/benchmarking/cli/ ↩︎ ↩︎ ↩︎
- ONNX Runtime documentation, “Quantize ONNX models.” https://onnxruntime.ai/docs/performance/model-optimizations/quantization.html ↩︎ ↩︎
- Hugging Face documentation, “Optimum Intel.” https://huggingface.co/docs/optimum-intel/en/index ↩︎ ↩︎
- AWS, “Evaluate Foundation Models — Amazon Bedrock Evaluations.” https://aws.amazon.com/bedrock/evaluations/ ↩︎ ↩︎
- OpenAI API documentation, “Evaluation best practices — LLM-as-a-judge and model graders.” https://developers.openai.com/api/docs/guides/evaluation-best-practices ↩︎ ↩︎
- MLCommons, “MLPerf Inference: Datacenter.” https://mlcommons.org/benchmarks/inference-datacenter/ ↩︎ ↩︎
- Lingjiao Chen, Matei Zaharia, James Zou, “FrugalGPT: How to Use Large Language Models While Reducing Cost and Improving Performance,” arXiv, 2023. https://arxiv.org/abs/2305.05176 ↩︎ ↩︎ ↩︎
- NIST AI Risk Management Framework Playbook, “Manage.” https://airc.nist.gov/airmf-resources/playbook/manage/ ↩︎ ↩︎